# Filters library
This documentation outlines the functionality and application of the filters available in the TradersLab stock screener. These filters are categorized to assist traders in refining their search based on various financial, technical, and fundamental criteria.
## **Profile Filters**
These filters help traders identify stocks based on fundamental descriptors such as geographic location, business sector, and industry specifics.
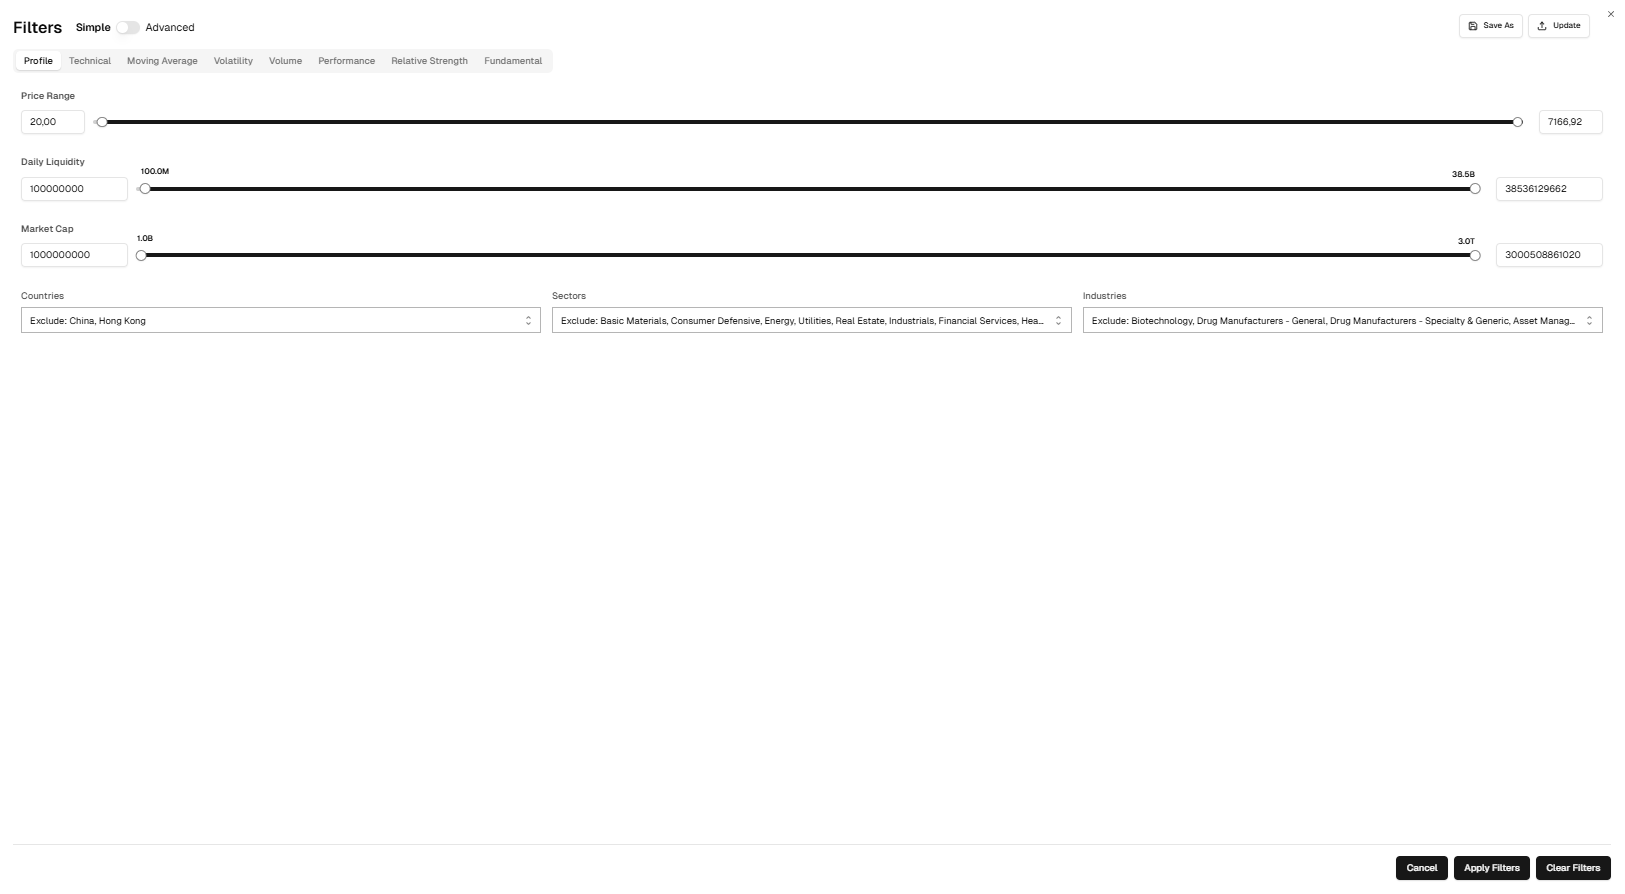
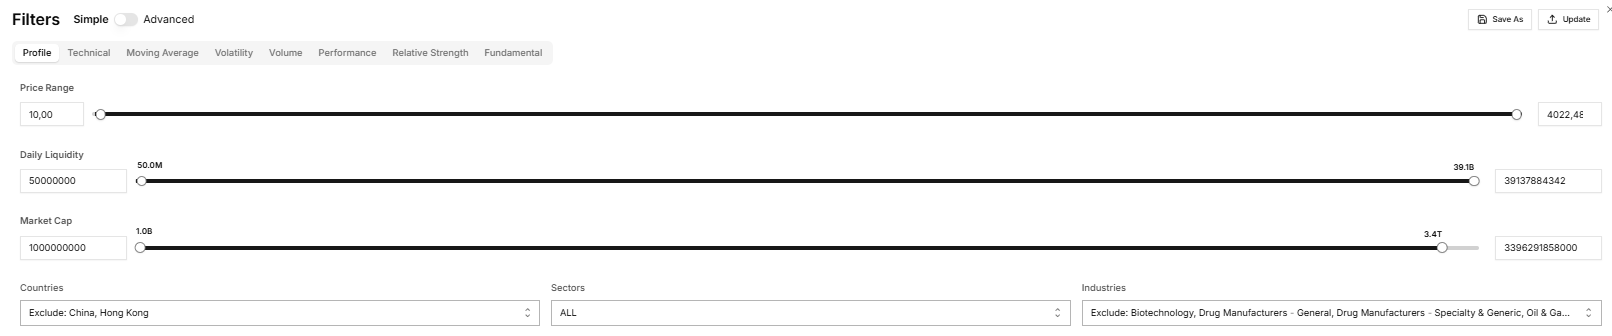
### **Price Range**
**Description**: Enables traders to define a minimum and maximum stock price, allowing them to focus on stocks within a specific price range that fits their preferences.
### **Market Cap Range**
**Description**: Filters stocks based on their market capitalization, offering options to target small-cap, mid-cap, or large-cap stocks depending on the trader's risk appetite and investment strategy.
### **Daily Liquidity**
**Description**: This filter allows traders to specify a range for the average daily trading volume of stocks, ensuring that selected stocks meet liquidity preferences which can impact trade execution and volatility.
**Range**: Traders can adjust the slider to set minimum and maximum thresholds for the average daily trading volume, measured in dollars.
### **Country Filter**
**Description**: Allows traders to select or exlude or specifically include stocks based on the country where they are headquartered.
### **Sector Filter**
**Description**: Classifies stocks into sectors reflecting their primary business activities, enabling traders to concentrate or exclude specific sectors
### **Industry Filter**
**Description**: Provides a more granular filter within sectors to target specific industries, helping traders to focus on or exclude some industries.
## **Technical Filters**
Technical filters utilize statistical criteria to help identify stocks based on trading data and technical indicators.
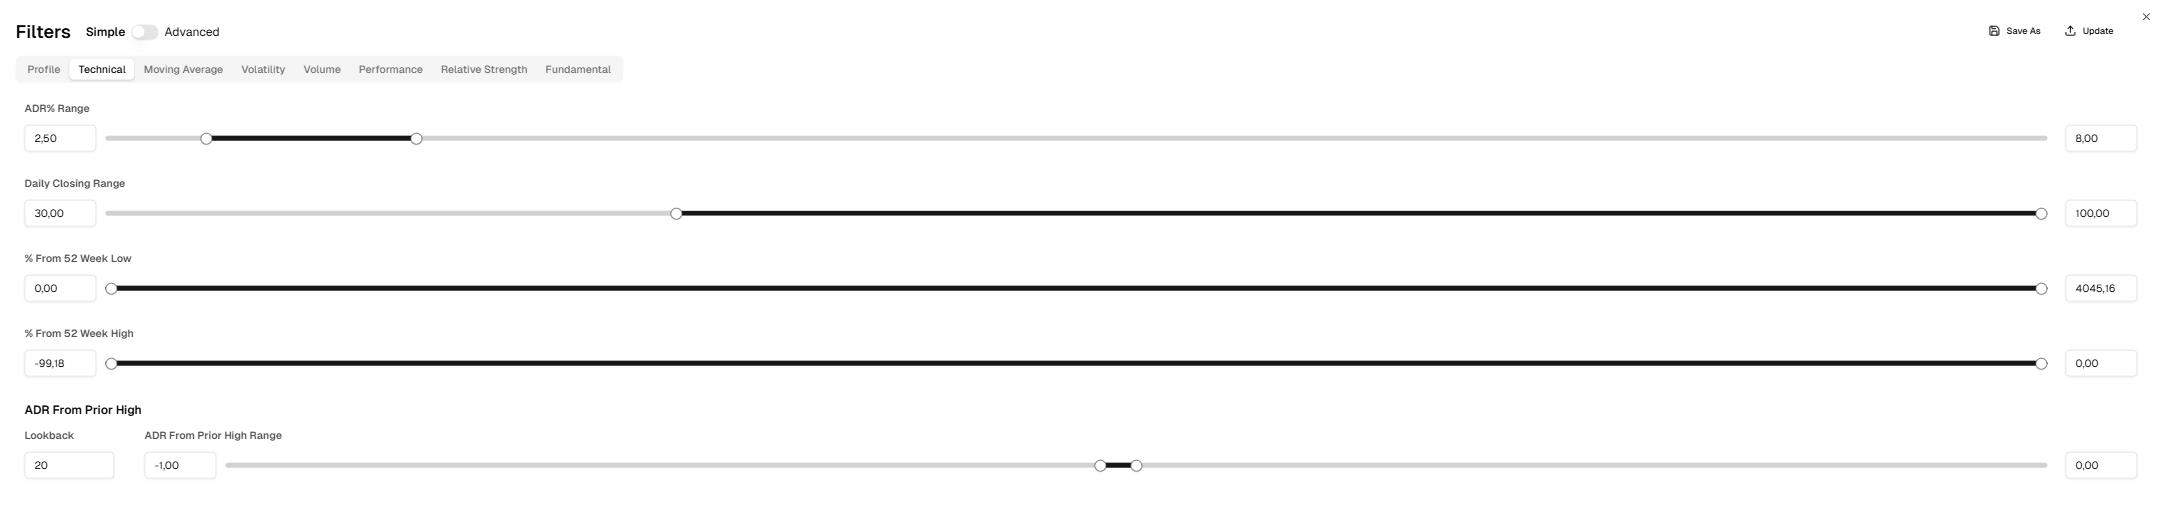
### **Average Daily Range (ADR) Percent**
**Description**: Filters stocks based on the average percentage range between the high and low prices over a defined period, useful for identifying stocks with high volatility for short-term trading.
**Calculation**: Determines the average range over a specified period and expresses it as a percentage of the stock price.
### **Daily Closing Range**
**Description**: The Daily Closing Range is a financial metric used to assess where a stock's closing price falls within the range of its daily price fluctuations. This measure helps identify the relative position of the closing price against the day's highest and lowest prices.
### **% From 52 Week Low**
**Description**: The % From 52 Week Low is a financial metric that measures the current stock price's percentage increase from its lowest price over the past 52 weeks. This indicator helps investors understand how much a stock has recovered from its lowest point in the last year, providing insights into potential growth or rebound trends.
### **% From 52 Week High**
**Description**: The % From 52 Week High is a financial metric that measures the current stock price's percentage decrease from its highest price over the past 52 weeks. This indicator is used to assess how far a stock has retreated from its peak level, offering insights into market sentiment and potential resistance levels.
### **ADR From Prior High**
**Description**: The *ADR From Prior High* parameter measures the percentage difference between the **current stock price** and the **prior high**, relative to the **Average Daily Range (ADR)**. This helps traders identify how far a stock has pulled back or how close it is to reclaiming its previous highs.
**Lookback Period:**
* This determines the number of past trading days used to **calculate the ADR** (not the prior high).
* A longer lookback period results in a **more stable ADR**, while a shorter period makes ADR more **responsive to recent volatility**.
### **ADR From Prior High Range:**
* This setting measures the stock’s price distance **from the prior high** in terms of its ADR.
**Example interpretations:**
* **-1.00** → The stock is **one full ADR below** the prior high.
* **0.00** → The stock is **at the prior high**.
* **0.50** → The stock is **half an ADR above** the prior high.
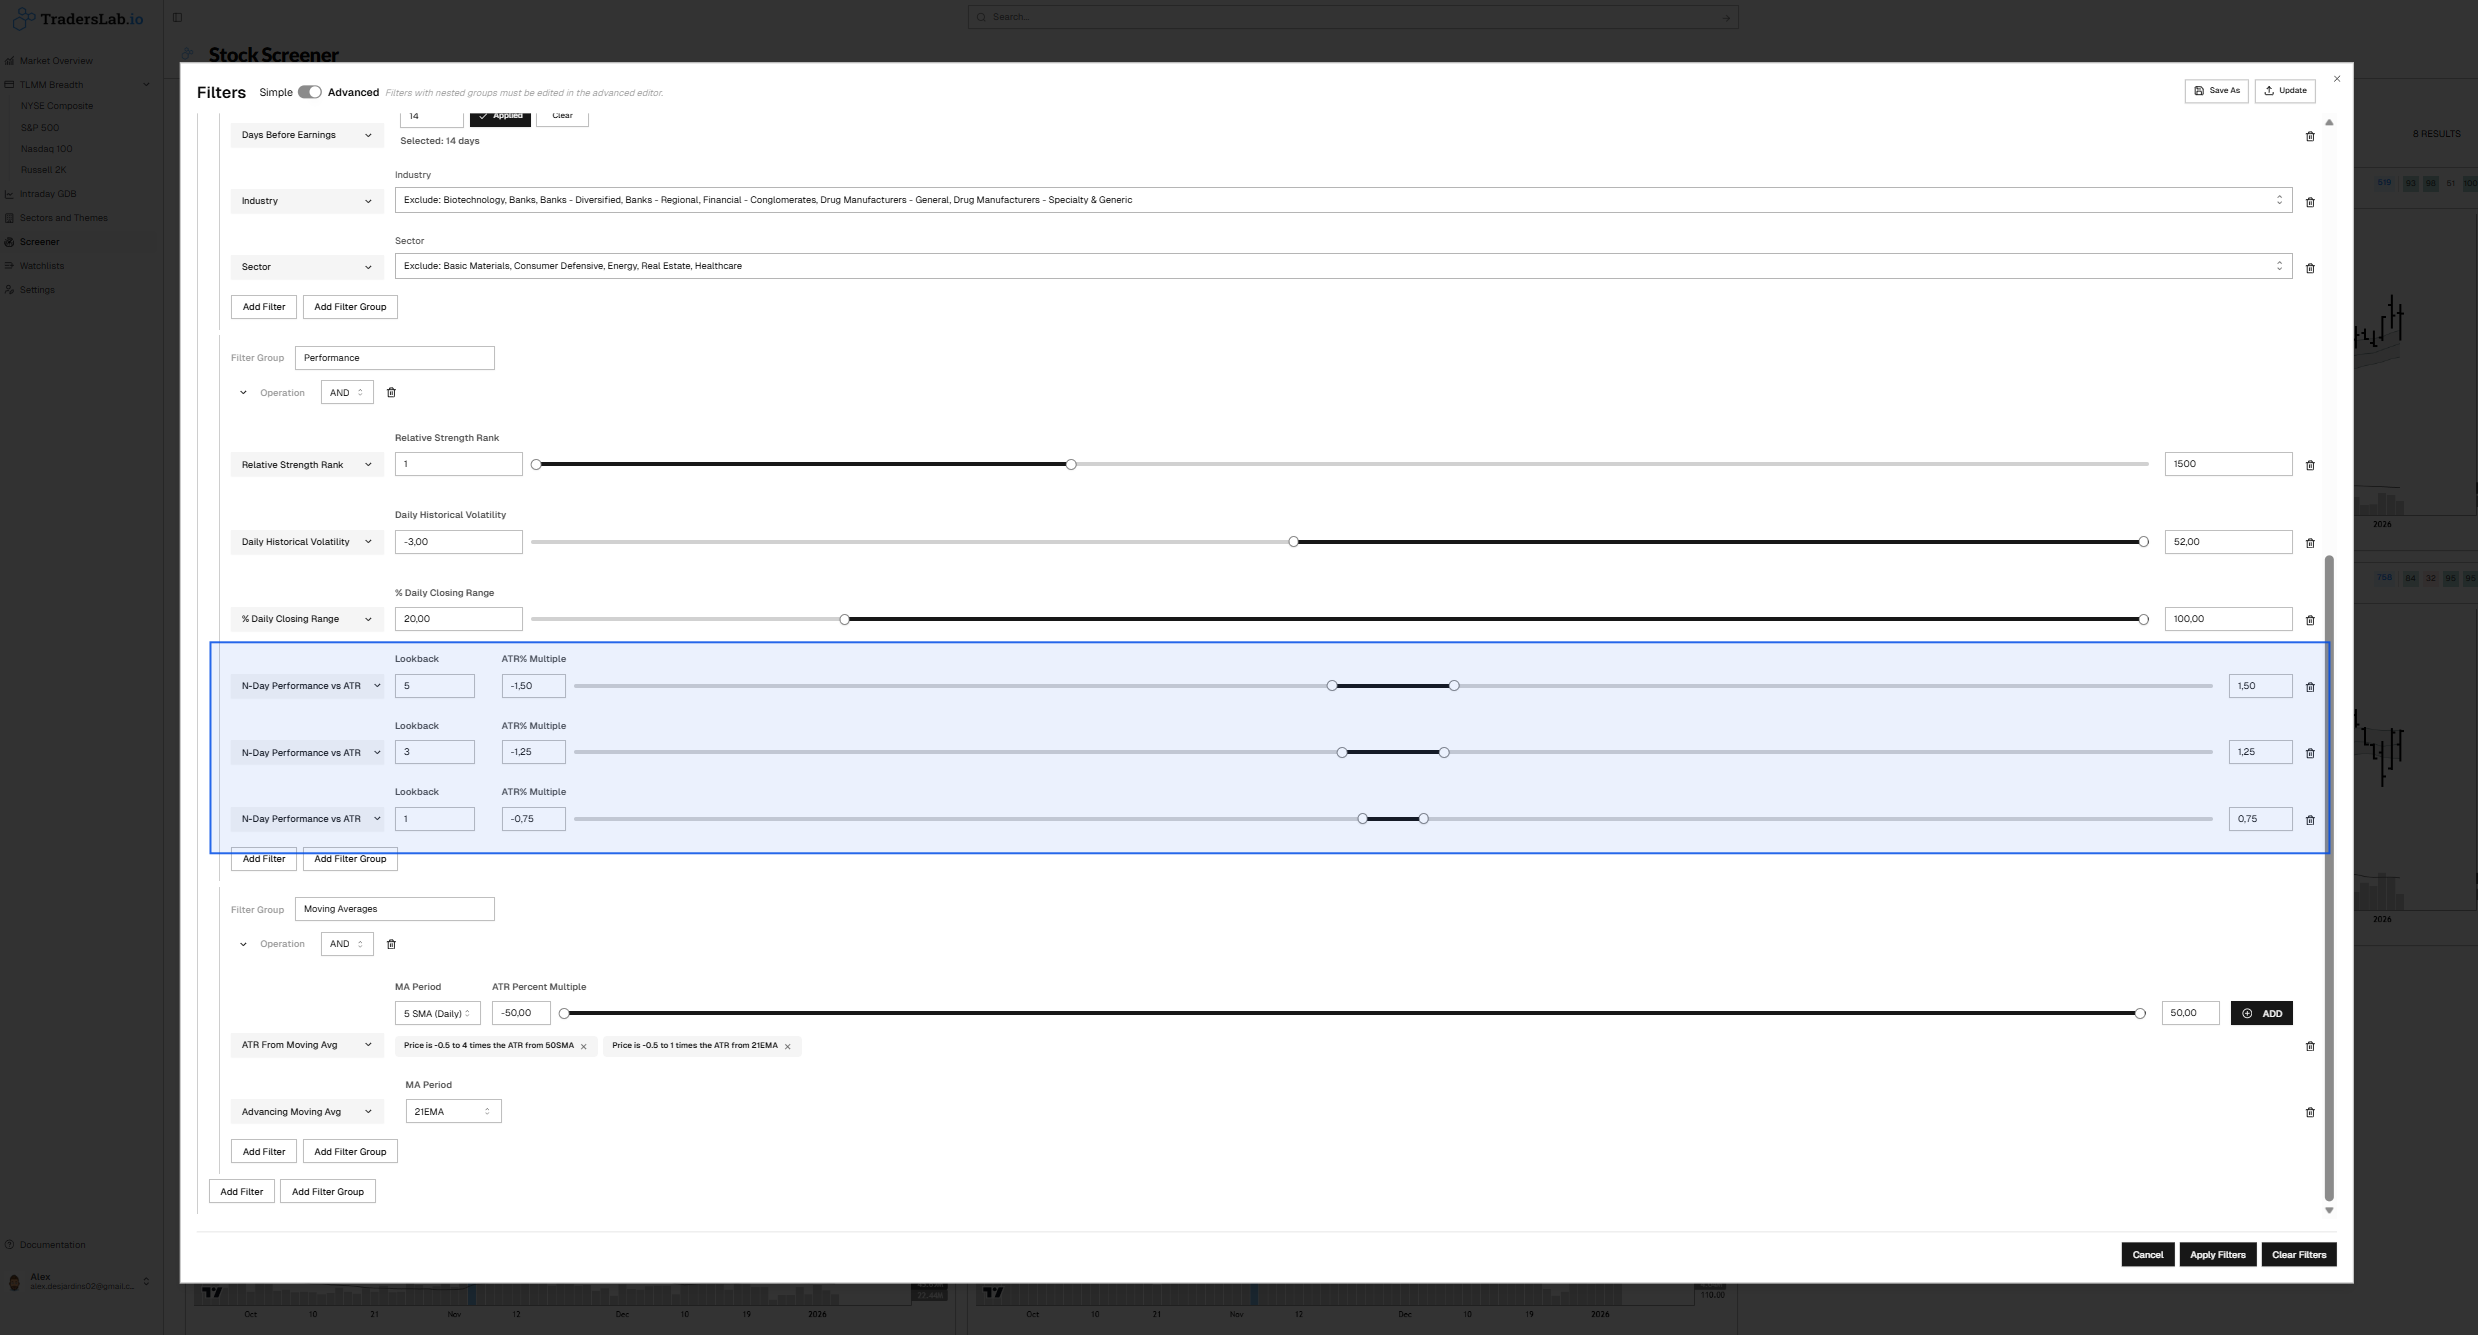
### N-Day Performance vs ATR (Multiples)
**Description**: The **N-Day Performance vs ATR** filter evaluates how far price has moved over a defined lookback period, expressed as a **multiple of Average True Range (ATR)**.
By normalizing price movement relative to volatility, the filter provides a consistent way to identify **contained, controlled price action** across stocks with different prices and volatility profiles.
#### How the Filter Works
1. Select a lookback period of **N days**
* The calculation **includes today’s close**
2. Calculate the **net price change** from N days ago to today
3. Divide that move by **ATR** to express it as an **ATR multiple**
4. The stock passes the filter if the result falls **within the defined ATR range**
#### Example
**Settings**
* Lookback: **3 days**
* ATR range: **–1.25 to +1.25**
**Interpretation**
* Price has moved **less than ±1.25 ATR** over the last 3 days
* Indicates **controlled, non-extended price behavior**
* Suitable for consolidation or early base development
#### Why ATR Multiples (Not % Change)
Raw percentage changes ignore volatility:
* A 3% move can be normal for one stock
* The same move can be extreme for another
ATR multiples:
* Adapt to each stock’s natural volatility
* Allow consistent thresholds across the market
* Focus on **price behavior**, not price level
#### Multi-Horizon Compression (Stacked Usage)
The **N-Day Performance vs ATR** filter can be applied **multiple times simultaneously**, each with a different lookback window.
This enables detection of **volatility compression across multiple time horizons**, a defining characteristic of high-quality base and **VCP-style setups**.
#### Why This Matters
True volatility contraction is rarely isolated to one timeframe.
High-quality structures often show:
* Very tight action over **1–2 days**
* Continued containment over **3–5 days**
* Broader control over **8–15 days**
Stacking ATR-based lookbacks allows TradersLab to isolate stocks where volatility is contracting **layer by layer**, rather than temporarily.
***
#### How the Filter Works
1. Select a lookback period of **N days**
* The calculation **includes today’s close**
2. Calculate the **net price change** from N days ago to today
3. Divide that move by **ATR** to express it as an **ATR multiple**
4. The stock passes the filter if the result falls **within the defined ATR range**
## **Moving Average Filters**
This category includes filters related to the moving average indicators, essential for identifying trends.
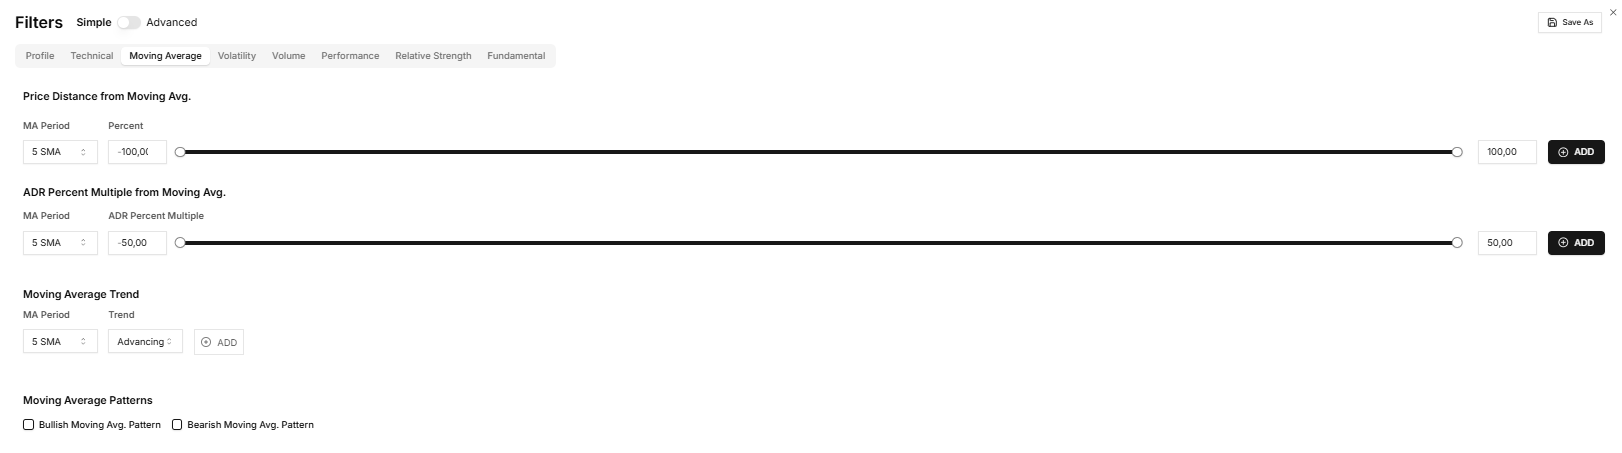
### **Price Distance from Moving Average**
The **Price Distance from Moving Avg.** filter in TradersLab allows users to screen stocks based on their price deviation from a selected moving average (MA). This filter can be customized to identify stocks that are trading significantly above or below their moving averages, which may indicate overbought or oversold conditions respectively.
**Configuration Options:**
* **MA Period**: Users can select the period of the moving average. The default setting in the screenshot is the 5-day Simple Moving Average (5 SMA).
* **Percent**: This slider allows users to set a percentage range from -100% to 100%. Stocks can be filtered based on how far their current price is from the moving average, expressed as a percentage. Setting the range to include negative values will filter for stocks trading below the moving average, while positive values will filter for those trading above it.
**Usage:**
To use this filter, follow these steps:
**Select the MA Period**: Choose the moving average period that fits your trading strategy.
**Adjust the Percent Slider**: Move the slider to define the percentage range. For instance:
* Setting the slider from -20% to 20% will find stocks whose prices are within 20% below or above the selected moving average.
* Setting it from 0% to 20% will filter for stocks trading up to 20% above the moving average.
* Setting it from -20% to 0% will filter for stocks trading up to 20% below the moving average.
**Add to Filter**: Click 'ADD' to apply the filter to your stock screener. This will update your screening results according to the defined settings.
This filter is particularly useful for traders looking to capitalize on mean reversion strategies or to identify momentum trends based on deviation from established moving averages.
### **ADR Percent Multiple from Moving Average Filter**
The **ADR Percent Multiple from Moving Average** filter helps traders to gauge the volatility of a stock relative to its moving average, providing a metric to understand how much a stock moves in a day compared to its average price over a given period. This is invaluable for identifying stocks with unusual price movements that could signal potential trading opportunities.
**Configuration Options**
**MA Period**: Users can choose the moving average period against which the ADR will be compared. Options include common periods like 5, 10, 21, 50, or 200 days, which can be set to either Simple Moving Average (SMA) or Exponential Moving Average (EMA).
**ADR Percent Multiple**: This slider controls the multiplier for the ADR relative to the moving average. It can be adjusted from -50.00 to +50.00, where:
* Positive values identify stocks whose daily range is significantly above the average, indicating higher volatility or potential breakout.
* Negative values focus on stocks with less daily fluctuation than the moving average, suggesting stability or consolidation.
**Usage**
To utilize the filter, follow these instructions:
**Select the Desired MA Period**: Set the moving average period that suits your trading strategy, choosing between SMA or EMA as needed.
**Adjust the ADR Percent Multiple Slider**: Slide to set the desired multiplier. For example:
* A setting of +30 indicates looking for stocks with a daily price range at least 30% greater than the moving average.
* A setting of -30 would target stocks whose daily price range is 30% less than the moving average.
**Add to Filters**: Click 'ADD' to apply this filter to the stock screening process.
### **Moving Average Trend Filter**
The **Moving Average Trend** filter enables traders to screen stocks according to the trend direction of their moving averages. This tool is pivotal for identifying potential bullish or bearish trends in stock prices relative to their average historical prices over selected periods.
**Configuration Options**
**MA Period**: Users can choose from various moving average periods such as 5, 10, 21, 50, or 200 days. Both Simple Moving Average (SMA) and Exponential Moving Average (EMA) types can be selected to suit different trading strategies.
**Trend**: This dropdown allows users to select the trend direction they wish to screen for:
* **Advancing**: Stocks whose moving average is trending upwards, indicating potential bullish behavior.
* **Declining**: Stocks with a downward-trending moving average, indicating potential bearish behavior.
**Usage**
To use this filter, follow these steps:
**Select the Moving Average Period**: Determine which MA period and type (SMA or EMA) align with your trading objectives.
**Choose the Trend Direction**: From the dropdown, select 'Advancing,' or 'Declining,' based on the type of trend you are looking for in potential investments.
**Add to Filters**: Click 'ADD' to apply this filter to your stock screener criteria.
### **Bullish Moving Avg. Pattern**
**Description**: The **Bullish Moving Avg. Pattern** filter identifies stocks exhibiting a strong upward trend based on the alignment of their moving averages. This pattern suggests a bullish market sentiment and is useful for traders looking to capitalize on upward momentum.
**Logic**:\
The stock must meet the following criteria:
* **10 EMA > 21 EMA**
* **21 EMA > 50 SMA**
* **50 SMA > 200 SMA**
**Usage**:\
Enable this filter to narrow your search to stocks displaying a bullish moving average configuration. These stocks are likely in an uptrend, making them potential candidates for long trades.
### **Bearish Moving Avg. Pattern**
**Description**: The **Bearish Moving Avg. Pattern** filter highlights stocks in a strong downward trend, indicated by the alignment of their moving averages in a bearish sequence. This pattern helps traders identify stocks with potential short-selling opportunities or those to avoid for long trades.
**Logic**:
The stock must meet the following criteria:
* **10 EMA < 21 EMA**
* **21 EMA < 50 SMA**
* **50 SMA < 200 SMA**
**Usage**:\
Activate this filter to identify stocks with a bearish moving average alignment. These stocks are likely in a downtrend, signaling caution for long trades or opportunities for bearish strategies.
## **Volatility Filters**
These filters assess the price variability and the degree of spread in the stock's price movements.
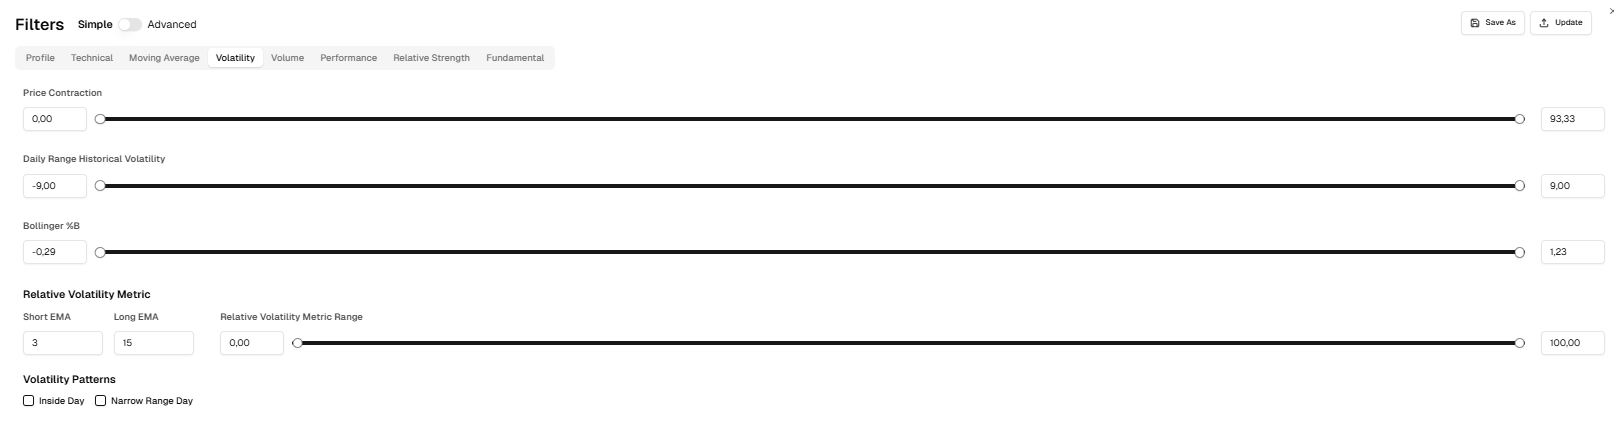
### **Price Contraction**
The **Volatility Contraction Score** quantifies the contraction or expansion of price volatility over a recent time period. This score is calculated as follows:
**Price Range Calculation**:
* For each of the last 15 trading sessions (candles), the price range is determined as the difference between the high and low prices.**Percentile Rank**:
* The price range of the current session is ranked relative to the price ranges of the previous 15 sessions using a percentile rank. This percentile rank represents the degree of volatility contraction or expansion.
* A lower percentile rank (closer to 0) indicates a contraction in volatility, meaning the current session has a narrower price range compared to recent sessions. Conversely, a higher percentile rank (closer to 100) indicates an expansion in volatility.
### **Daily Range Historical Volatility**
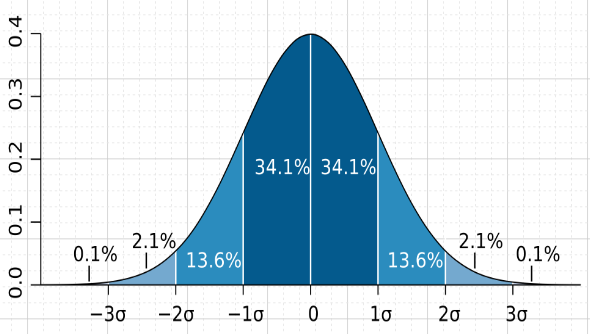
The Daily Range Historical Volatility quantifies the variation or dispersion of an asset's price within a single trading day over a specific historical period. This measure is calculated as follows:
**Volatility Calculation:**
* Calculate the standard deviation of the high-to-low price ranges for each trading session over the chosen historical period (14 days). This statistical measure provides an indication of the average deviation from the mean price range.
**Interpretation:**
* A higher standard deviation indicates greater volatility, showing that the asset experienced significant daily price movements within the period analyzed.
* Conversely, a lower standard deviation suggests that the asset's daily price movements were more subdued and stable.
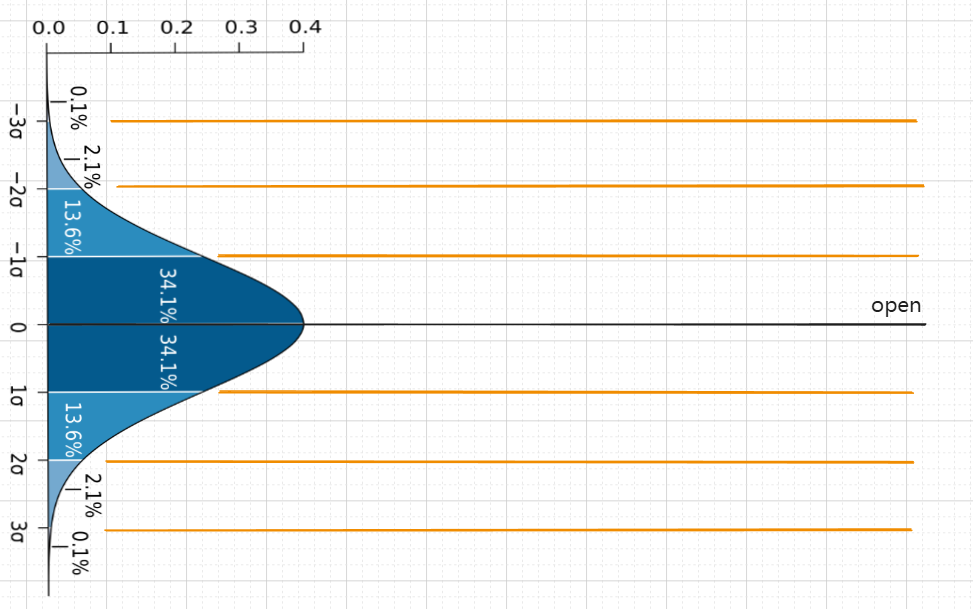
This distribution can give us statistical levels (often used by algos) for support/resistance based on historical volatility given by the distribution of daily range. Imagine an overlay of the distribution onto price at the day open where the open is placed at 0. From this we can build so called "hidden" support and resistance levels.
### **Bollinger %B**
**Definition:** The *Bollinger %B* indicator measures a stock’s price relative to its **Bollinger Bands**, helping traders understand whether a stock is near its upper or lower band. This is useful for detecting **overbought, oversold, or breakout conditions**.
* **0.00** → The stock is exactly at the lower Bollinger Band.
* **1.00** → The stock is exactly at the upper Bollinger Band.
* **Below 0.00** → The stock is trading below the lower Band.
* **Above 1.00** → The stock is trading above the upper Band.
#### **How Traders Use This:**
* **Breakout Confirmation:** Stocks sustaining above 1.00 often indicate strong momentum.
* **Reversal Signals:** Readings below 0.00 may indicate an oversold condition.
* **Mean Reversion Trades:** Traders look for price returning to the middle Bollinger Band after extreme deviations.
### **Relative Volatility Metric**
**Definition:** The *Relative Volatility Metric* measures how a stock's **short-term volatility** compares to its **longer-term volatility**. This helps traders identify whether a stock is experiencing **increased momentum** or **contracting volatility**, which often precedes significant price moves.
#### **Components:**
**Short EMA:**
* The **Exponential Moving Average (EMA)** applied to the stock’s recent volatility.
* A lower value (e.g., 3) makes it **more sensitive** to short-term changes.
**Long EMA:**
* The EMA applied to a **longer timeframe** of volatility.
* A higher value (e.g., 15) smooths out fluctuations, capturing **broader trends** in volatility.
**Relative Volatility Metric Range:**\
Defines the range of values traders can filter for.
* **Higher values** indicate short-term volatility is expanding faster than long-term, signaling potential breakouts.
* **Lower values** indicate volatility is contracting, a setup often seen before significant price moves.
{% hint style="info" %}
#### **How Traders Use This**
**Breakout Spotting:** Stocks with **low relative volatility** often signal price compression before explosive moves.\
**Momentum Confirmation:** If **short-term volatility is rising faster** than long-term, it suggests increasing price action intensity.\
**Reversal Signals:** A collapse in short-term volatility after a spike may indicate trend exhaustion.
{% endhint %}
### **Volatility Patterns Filter**
The **Volatility Patterns** filter equips traders with the ability to identify stocks exhibiting specific volatility patterns that may indicate pending price breakouts or consolidations. The two primary patterns used in this filter are **Inside Day** and **Narrow Range Day**.
**Configuration Options**
**Inside Day**: This checkbox allows users to filter for stocks that have completed an "Inside Day," which occurs when the entire day's price range is within the range of the previous day. This pattern can indicate a potential tightening of price movement and is often considered by traders as a precursor to a significant breakout or breakdown.
**Narrow Range Day**: This checkbox targets stocks that have experienced a "Narrow Range Day," characterized by the smallest daily price range (high to low) within the last seven sessions. This pattern suggests decreasing volatility and can be an indicator of consolidation before a price move.
**Usage**
To use these filters, follow these steps:
**Select Desired Patterns**: Check the box next to "Inside Day" or "Narrow Range Day" depending on the specific volatility pattern you are interested in identifying.
## **Volume Filters**
Volume filters analyze trading volume to gauge the strength behind price movements.
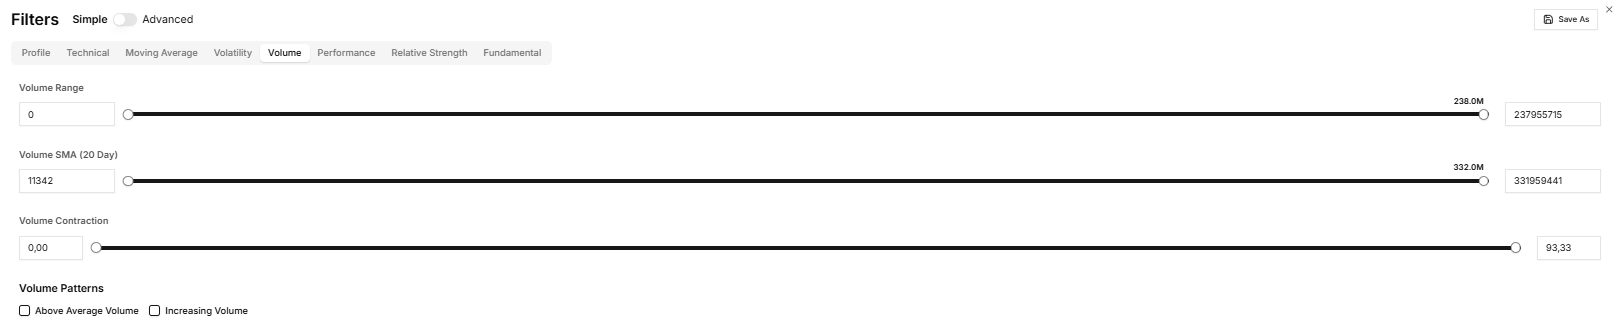
### **Volume Range**
**Description**: Sets criteria based on the average number of shares traded, helping ensure selected stocks have sufficient liquidity for entry and exit without significant market impact.
### **Volume SMA (20 Day) Filter**
The **Volume SMA (20 Day)** filter allows traders to identify stocks with trading volumes that are above or below their 20-day simple moving average (SMA) of volume. This tool is essential for assessing the liquidity and market interest in a stock over a short to medium-term period.
**Configuration Options**
**Volume Range Slider**: This slider enables users to set a specific range for the volume, from a minimum to a maximum, expressed in shares.
### **Volume Contraction**
The **Volume Contraction Score** measures the relative contraction or expansion of trading volume over the same recent period. The steps are as follows:
**Volume Calculation**:
* The total trading volume is measured for each of the last 15 trading sessions.
**Percentile Rank**:
* The current session’s volume is ranked against the previous 14 sessions using a percentile rank. This rank reflects how the current volume compares to historical volumes.
* A lower percentile rank suggests a contraction in volume, indicating reduced market activity compared to recent sessions. A higher percentile rank suggests a volume expansion, with increased market activity.
### **Volume Patterns**
**Above Average Volume:**
This filter identifies stocks where the current trading volume exceeds the average trading volume over a specified time period (e.g., 20 days). It helps traders focus on stocks experiencing higher-than-usual trading activity, which could indicate heightened interest or potential breakout opportunities.
**Increasing Volume:**
This filter captures stocks that are seeing a rise in trading volume compared to the previous trading session. Stocks with increasing volume can signal momentum, as rising volume often accompanies price moves, either upward or downward, indicating growing investor interest or participation.
## **Performance Filters**
These filters track the performance of stocks over specified periods to identify trends or reversals.
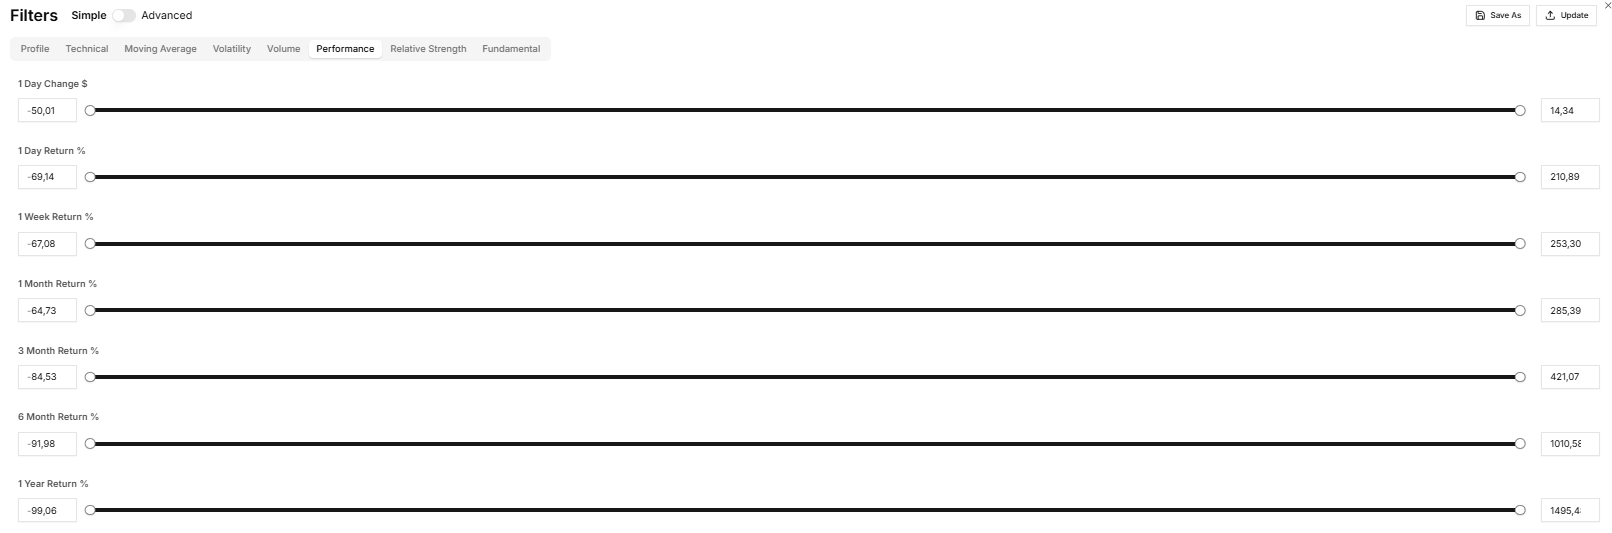
#### **1-Day, 1-Week, 1 to 12 Months Return**
* **Description**: Allows traders to screen stocks based on their performance over short-term periods, facilitating strategies that capitalize on recent movements.
* **Calculation**: Calculates the return percentage by comparing the current price to the price at the end of the specified period.
## **Relative Strength Filters**
Relative strength filters compare the performance of stocks against each other or the market as a whole.
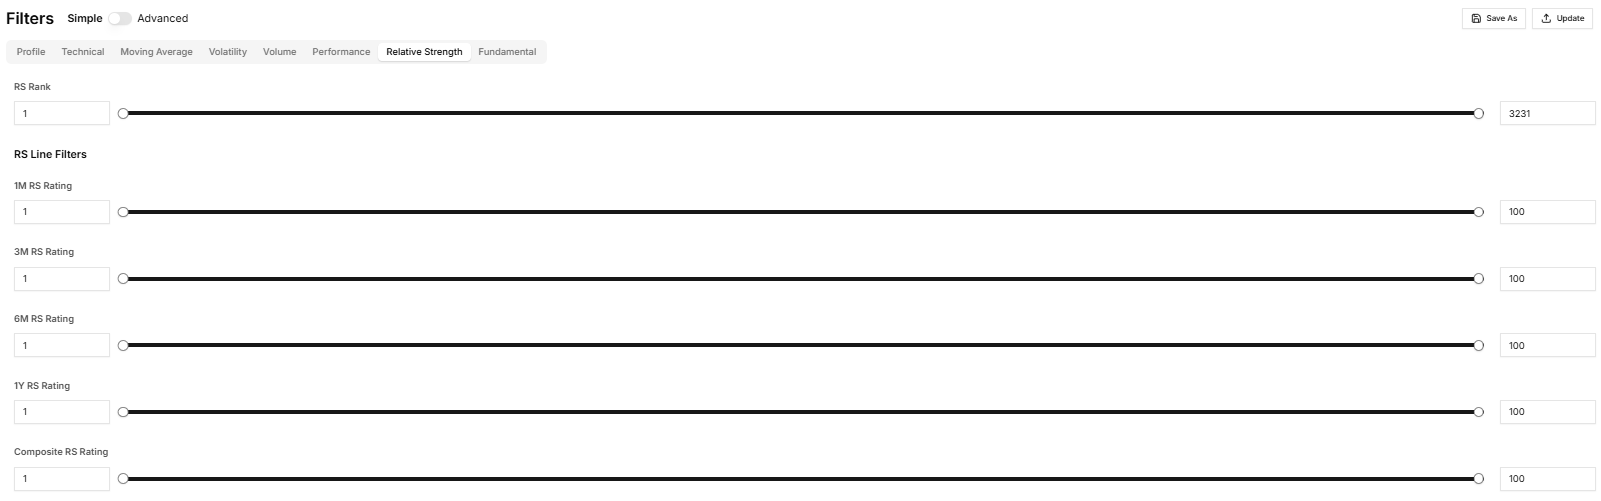
#### **RS Rank**
This is Alex's proprietary score that takes into account a stock’s **performance over multiple timeframes**, including **1 month to 1 year**, along with the **stock’s distance from its 52-week high and low**. This scoring system gives traders a comprehensive overview of how well the stock has performed relative to its peers and benchmarks over both the short and long term, allowing for better insight into the stock's strength in various market conditions.
#### **1M RS Rating**
This filter screens for stocks based on their **1-month Relative Strength Rating**. It compares a stock's performance to the broader market over the past month. A higher rating means the stock has shown strong price movement over the last 30 days compared to the market.
#### **3M RS Rating**
This filter looks at the **3-month Relative Strength Rating**. It helps traders identify stocks that have outperformed the market over the past quarter (3 months), giving a medium-term perspective on a stock’s relative performance.
#### **6M RS Rating**
The **6-month Relative Strength Rating** allows traders to filter for stocks that have demonstrated strength over the last six months. It is useful for identifying stocks that have shown consistent performance over a longer period.
#### **1Y RS Rating**
This filter evaluates stocks based on their **1-year Relative Strength Rating**, which compares the stock’s performance to the broader market over the past year. It helps traders focus on stocks with strong long-term performance.
#### **Composite RS Rating**
The **Composite RS Rating** combines multiple timeframes (such as 1 month, 3 months, 6 months, and 1 year) to create an aggregate relative strength score. This rating offers a more comprehensive view of a stock’s performance across multiple time periods, making it a powerful tool for assessing overall strength in different market environments.
These filters give traders a way to focus on stocks that show strong relative performance in various timeframes, making it easier to find stocks that are outperforming the market consistently.
## **Fundamental Filters**
These filters utilize financial data to assess the health and performance of companies.
### **Earnings Filter**
* **Description**: Enables traders to include or exclude stocks based on upcoming earnings reports, which can significantly impact stock prices due to new financial information or investor sentiment changes.
* **Calculation**: Identifies stocks with upcoming earnings announcements within a specified time frame and filters based on the presence or absence of these events.